
 6
6


- Tim's Homestead Journal - Purchase a copy of Building a Better World in Your Backyard - Purchase 6 Decks of Permaculture Cards -
- Purchase 12x Decks of Permaculture Cards - Purchase a copy of the SKIP Book - Purchase 12x copies of Building a Better World in your Backyard
 3
3


Zone 6, 45 inches precipitation, hard clay soil


 5
5


 9
9


Visit Redhawk's soil series: https://permies.com/wiki/redhawk-soil
How permies.com works: https://permies.com/wiki/34193/permies-works-links-threads
 3
3


Peter E Johnson wrote:I know ranchers that were having to use straight #1 diesel in their trucks last winter, because the winter blend diesel was gelling. They were saying it was -30-40F at night for about a week, and the cows and sheep were coughing up blood, because it was frosting their lungs.

 7
7


Some places need to be wild
 4
4


Is there such a thing as too many projects going?
 5
5


Douglas Alpenstock wrote:
I can't speak to your experience, though I must say it doesn't mesh with my experience.
Winter diesel up here (perhaps a different formulation?) keeps everything humming along through our very cold and long winter.
Also, I have spent many years working with cattle in this cold climate. They toughen up and adapt to the cold, like humans do, given adequate feed and shelter. I think they are tougher than humans, frankly. I have never seen one coughing up blood when it gets cold.


 1
1


- Tim's Homestead Journal - Purchase a copy of Building a Better World in Your Backyard - Purchase 6 Decks of Permaculture Cards -
- Purchase 12x Decks of Permaculture Cards - Purchase a copy of the SKIP Book - Purchase 12x copies of Building a Better World in your Backyard
 3
3


“It’s said war—war never changes. Men do, through the roads they walk. And this road—has reached its end.”


 3
3


"Never doubt that a small group of thoughtful, committed citizens can change the world; indeed, it's the only thing that ever has."-Margaret Mead "The only thing worse than being blind, is having sight but no vision."-Helen Keller

 3
3


“It’s said war—war never changes. Men do, through the roads they walk. And this road—has reached its end.”
 2
2


 3
3


How Permies works: https://permies.com/wiki/34193/permies-works-links-threads
My projects on Skye: The tree field, Growing and landracing, perennial polycultures, "Don't dream it - be it! "


Budding permie fanatic.
 4
4


Permaculture...picking the lock back to Eden since 1978.
Pics of my Forest Garden
 6
6


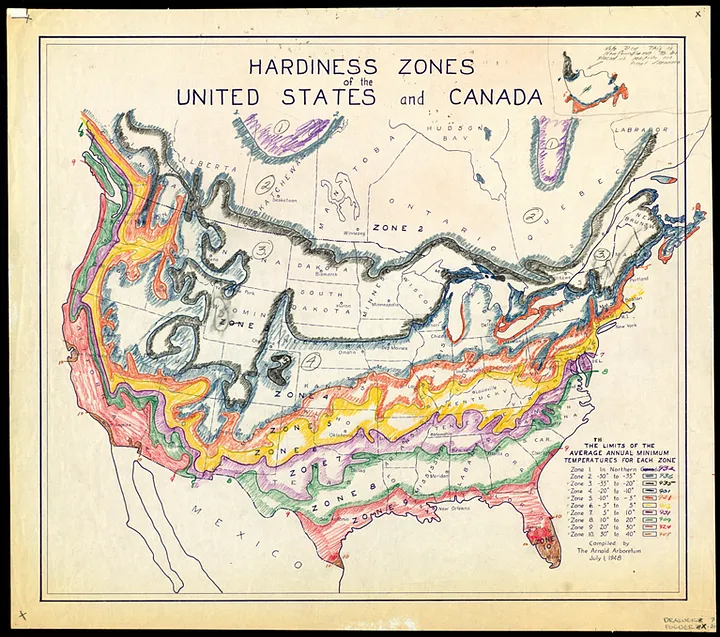
Greg Martin wrote:I went to the interactive map and found that my road is 6A, surrounded in a sea of 5b....fun! I do live in a forest on a hillside and we do get extra protection from the cold. I'm just amazed the map caught that somehow. Can they really be that good?
In the end, data from a total of 13,625 stations—a substantial increase compared to the 2012 map version--were incorporated into the maps. The USDA PHZM was produced with the latest version of PRISM, a highly sophisticated climate mapping technology developed at Oregon State University. The map was produced from a digital computer grid, with each cell measuring about a half mile on a side. PRISM estimated the mean annual extreme minimum temperature for each grid cell (or pixel on the map) by examining data from nearby stations; determining how the temperature changed with elevation; and accounting for possible coastal effects, temperature inversions, and the type of topography (ridge top, hill slope, or valley bottom).


 1
1


Winn Sawyer wrote:
Greg Martin wrote:I went to the interactive map and found that my road is 6A, surrounded in a sea of 5b....fun! I do live in a forest on a hillside and we do get extra protection from the cold. I'm just amazed the map caught that somehow. Can they really be that good?
The page where they discuss the methodology says that yes, they can really be that good! Here's a quote from there:
In the end, data from a total of 13,625 stations—a substantial increase compared to the 2012 map version--were incorporated into the maps. The USDA PHZM was produced with the latest version of PRISM, a highly sophisticated climate mapping technology developed at Oregon State University. The map was produced from a digital computer grid, with each cell measuring about a half mile on a side. PRISM estimated the mean annual extreme minimum temperature for each grid cell (or pixel on the map) by examining data from nearby stations; determining how the temperature changed with elevation; and accounting for possible coastal effects, temperature inversions, and the type of topography (ridge top, hill slope, or valley bottom).
"Never doubt that a small group of thoughtful, committed citizens can change the world; indeed, it's the only thing that ever has."-Margaret Mead "The only thing worse than being blind, is having sight but no vision."-Helen Keller
 4
4


Roberto pokachinni wrote:
Now if they took data like that, loaded about 5 years worth of it into an AI, they would probably see that the variation in the average is, as stated by Jay Angler, likely to come out a great deal more extreme.


'It is a plant of great virtue;...therefore, give God thanks for his goodness, Who hath given this herb and all others for the benefit of our health.' (Mattheolus/Fuschius)


I do Celtic, fantasy, folk and shanty singing at Renaissance faires, fantasy festivals, pirate campouts, and other events in OR and WA, USA.
RionaTheSinger on youtube
 8
8


 2
2
 1
1


 1
1


Oscar Domstede wrote:
The numbers from local weather stations and airports are not even remotely what they are showing.

 1
1


First, let's discuss how the zones are calculated. The zones are calculated based on 30 years of temperature data (1991 to 2020). For each year, the lowest temperature of the year is recorded. Next, the average of those 30 numbers is taken and compared to the scale. Each zone on the scale has a width of 10 degrees F. Each sub-zone has a width of 5 degrees F. For example, zone 6 spans from -10 deg F to 0 deg F, with zone 6b being -5 to 0 and zone 6a being from -10 to -5. To illustrate this, in the chart below, I pulled the temperature data from the weather station at Indianapolis International Airport. Each red column represents the minimum extreme temperature for that year. The horizontal blue line is the average of all 30 years. In this case, that average is -4.9 deg F. This means that, for this particular region, the hardiness zone designation is zone 6b. Note that this average number is the ONLY factor used in calculating hardiness zones. Summer temperatures, chill hours, growing degree days, number of frost free days, etc. have absolutely no direct influence on the hardiness zone calculation.
Next, let's discuss how to use the hardiness zone information. First off, the hardiness zone means virtually nothing regarding the growing of annual plants. This is because those plants are not even alive when the minimum low temperatures occur. Whether it gets to -20 or -40 in the winter doesn't (directly) impact what tomatoes you can grow in your garden. Next, people are sometimes tempted to think like this: "I'm in zone 6b. Zone 6b goes down to -5 deg F. So if the tree or perennial that I'd like to plant is hardy to -5 deg F, then all is well." This is incorrect. To illustrate this, look at the IND airport temperature chart again. Yes, the *average* minimum temperature is -4.9 deg F, however, 15 of the 30 years had low temperatures lower than -5 deg F. In fact, in 1994, the temperature got down to -27 deg F (more on that later). So if whatever you plant can only take down to -5 deg F, there's a 50-50% chance that it will get damaged/killed any given winter. I don't like those odds.
To get the whole picture, we need to look at more than just the average. Statisticians use a metric called the standard deviation to quantify how much variation there is in any given data set. If a data set has a large standard deviation, there is a lot of variation. Conversely, a small standard deviation indicates little variation. I won't get into the math details here, but a simple online search can tell you how to calculate standard deviation. Most natural distributions are distributed like the classic "bell curve", also called a "normal distribution". Statistically, 67% of all the data falls within +/- one standard deviation of the average; 95% of the data falls within +/- 2 standard deviations, and 99.7% falls within +/- 3 standard deviations. Returning to our IND airport example, the standard deviation of that data set is 7.7 deg F. So, the average minus one standard deviation is -12.6 deg F (-4.9 minus 7.7), This is shown on the chart with the green line. Statistically, we would expect 16% of the data to be greater than the average minus one standard deviation. This means that roughly one out of every 6 years, we would expect temperatures to dip down to at least -12.6 deg F. In our example, it happened twice (1994 and 2014). If you are planting a tree that you expect to be around for 20+ years, one in 6 still feels like pretty poor odds to me.
If we use two standard deviations rather than one, statistically speaking, we would expect 97.6% of the data to be above the average minus two standard deviations. This would mean we would expect roughly one year in every 42 years to have a low temperature less than this value. In our example, the average minus two standard deviations is -20.4 deg F, shown by the gray line in the chart. As you can see, we did have one example (1994) when the low temperature did get that low. Note that this temperature, -20.4, would actually correspond to zone 4b on the hardiness zone scale. So we would need our tree to be "zone 4 hardy" to be happy here in zone 6. We could keep going, but hopefully you understand the process here. Statistically, only 1 year out of every 700 years should fall below the average minus 3 standard deviations.


Winn Sawyer wrote:
Do you have specific examples? I've pulled the daily temperature data from here for my area and it agrees perfectly with the new zone:
https://www.ncei.noaa.gov/cdo-web/search?datasetid=GHCND
 2
2


Oscar Domstede wrote:
Couldn't make that work.


Peter E Johnson wrote:It looks to warm along the continental divide to me.
 6
6


“The most important decision we make is whether we believe we live in a friendly or hostile universe.”― Albert Einstein


 4
4


'What we do now echoes in eternity.' Marcus Aurelius
How Permies Works Dr. Redhawk's Epic Soil Series


Nurturing a full spectrum of favorite ornamental and edible trees, shrubs, vines, perennials, and groundcovers all grown on their own roots...
All to better enjoy the profound beauty and wonder of nature. Check out my site at www.onmyownroots.com !

|
No, tomorrow we rule the world! With this tiny ad:
Learn Permaculture through a little hard work
https://wheaton-labs.com/bootcamp
|
