• Post Reply Bookmark Topic Watch Topic
  • New Topic
permaculture forums growies critters building homesteading energy monies kitchen purity ungarbage community wilderness fiber arts art permaculture artisans regional education skip experiences global resources cider press projects digital market permies.com pie forums private forums all forums
this forum made possible by our volunteer staff, including ...
master stewards:
  • Carla Burke
  • Nancy Reading
  • r ransom
  • John F Dean
  • paul wheaton
  • Jay Angler
stewards:
  • Timothy Norton
  • Pearl Sutton
  • Tereza Okava
master gardeners:
  • Christopher Weeks
  • M Ljin
gardeners:
  • Jeremy VanGelder
  • Matt McSpadden
  • thomas rubino

Basemaps

 
Posts: 6
4
  • Likes 6
  • Mark post as helpful
  • send pies
    Number of slices to send:
    Optional 'thank-you' note:
  • Quote
  • Report post to moderator
Hi everyone,

I built a basemap package for my own design work.  I’m now offering it as a service and would appreciate some feedback.  


This is a standardized map set that I use as the foundation for land planning and design work. It pulls together, in one coherent dataset:

Data layers

     -USGS LiDAR–derived elevation and terrain layers (slope, aspect, hillshade, color relief)

     -Hydrology extracted from surface topography (streams, watershed basins, flow accumulation, wetness index)

    -NRCS soils (soil series, hydrologic group, drainage class, depth to watertable, depth to restrictive layer, root zone available water storage, NCCPI, soil organic carbon, and engineering layers)

    -Land cover including parcels, buildings, and roads when available

    -Clean, smoothed contours

Delivery formats

    -A full QGIS project with map themes and atlas layouts

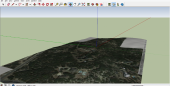
    -Google Earth Pro overlays for easy viewing

    -DXF export for people working in CAD

    -PDFs


This is not a design or a survey, it is just the starting point for design.  I would expect folks to take these basemaps and build their designs on them, whether in GEPro, QGIS, Illustrator, CAD, Overyield, etc.  


I'm just looking for honest feedback:

Is this actually useful?

Would you use something like this yourself, or point clients toward it?

Are there layers you would like to see that aren’t here?

Are there maps here that feel like noise?

Is it worth $150?


I’m happy to answer questions!

Check it out at www.forestshepherd.farm/basemaps

-Greg
 
pollinator
Posts: 220
Location: Colorado Plateau, New Mexico
48
fungi foraging composting toilet building solar greening the desert
  • Likes 3
  • Mark post as helpful
  • send pies
    Number of slices to send:
    Optional 'thank-you' note:
  • Quote
  • Report post to moderator
Cool work!

The link you posted didn't work. I was able to get to this page which might be what you meant? https://www.forestshepherd.farm/basemaps

I do love maps and think this is cool, but I would probably not pay $150 for a map because it's fun enough to dig around the freely available tools and I like doing that. I could imagine there might be people who want the info and don't enjoy nerding out themselves to find what they need.
 
G Sherb
Posts: 6
4
  • Likes 1
  • Mark post as helpful
  • send pies
    Number of slices to send:
    Optional 'thank-you' note:
  • Quote
  • Report post to moderator
Thanks Kimi for the feedback!
 
Kimi Iszikala
pollinator
Posts: 220
Location: Colorado Plateau, New Mexico
48
fungi foraging composting toilet building solar greening the desert
  • Likes 5
  • Mark post as helpful
  • send pies
    Number of slices to send:
    Optional 'thank-you' note:
  • Quote
  • Report post to moderator
Actually I took a second look (I only noticed the first page last night, and I was in a hurry to give you the link info in case others had a hard time finding).

This has so much more than I realized. The water info is so detailed. I wonder if that would work in a place like ours, which has trickles, gullies, and arroyos on almost every square foot, but water running in the main arroyos only 0-8 days per year? The water info would probably be the most interesting to us, although the slope aspect is also so useful. And if I gave it a half-hour peruse instead of 10 minutes, I would probably find more.
 
G Sherb
Posts: 6
4
  • Likes 2
  • Mark post as helpful
  • send pies
    Number of slices to send:
    Optional 'thank-you' note:
  • Quote
  • Report post to moderator
Kimi, thank you again!

Short Answer: Yes, this will work on your land.  In some ways it may be even more important in your dry place since you need to ensure you don't waste a single drop of water.


Longer Answer:  The topography and hydrology maps are based on a Digital Elevation Model (DEM) which is basically a picture of the shape of the land.  A drone equiped with lidar (which you can think of as a laser range finder) flew over your property and recorded elevations.  Out here in the East there is pretty much 1 meter resolution (that's the pixel size) everywhere, out West you may have 3 meter resolution.  This means there is an average elevation derived from that lidar for every square meter, or 3 square meters.  Even 3 meter is a highly accurate model of the shape of the land.  

The hydrology algorithm finds the paths where water would flow by finding the lowest pixel of the 8 surrounding any given pixel.  So this does a good job modelling overland flow whether or not there is typically water on the land - it is an output based on the shape of the land itself.  

QGIS has some nice tools for highlighting the watershed of a given point on the map.  I'm working on a way to combine this with the flow modelling and the underlying soil data from some of the other maps, like drainage class and hydrologic group, to get a more accurate picture of how much water would flow overland through a point vs infiltrate along the way- if anyone has advice or knows of a tool that does this please let me know.  I would like this information to estimate the potential capacity of a pond site and spillway sizing.  

The slope and aspect maps you mentioned are interesting because they reveal some interesting things about the land that can be hard to see even in real life.  The aspect map of my farm shows clearly where and in which direction my field was plowed, which hasn't happened in over 30 years.  Most of these plow lines are imperceptible, even though I was used to looking for things like this when I worked as a surveyor.  It all ties together - these plow lines are affecting the hydrology of my field (negatively in my opinion) and having all the maps in one place helps put things in perspective.  

 
Kimi Iszikala
pollinator
Posts: 220
Location: Colorado Plateau, New Mexico
48
fungi foraging composting toilet building solar greening the desert
  • Mark post as helpful
  • send pies
    Number of slices to send:
    Optional 'thank-you' note:
  • Quote
  • Report post to moderator
Hey Greg,

Is the price a flat rate regardless of the property size?

Kimi
 
Kimi Iszikala
pollinator
Posts: 220
Location: Colorado Plateau, New Mexico
48
fungi foraging composting toilet building solar greening the desert
  • Mark post as helpful
  • send pies
    Number of slices to send:
    Optional 'thank-you' note:
  • Quote
  • Report post to moderator
...also, I guess you need QGIS to read the maps? Is there other software you need? And I assume you can zoom in to whatever part of the land you want to look at?
 
G Sherb
Posts: 6
4
  • Likes 1
  • Mark post as helpful
  • send pies
    Number of slices to send:
    Optional 'thank-you' note:
  • Quote
  • Report post to moderator
Kimi,

Short answers: Flat rate up to 1000 acres.  No you do not need QGIS.  You can view/interact with the maps using any or all of the following:  Any PDF viewer, Google Earth Pro (or anything that reads KMZs such as Overyield, which is web based), QGIS, or any kind of AutoCAD.  

If you want to go real old school you can just take the PDFs to your local print shop and they are ready to print to scale on large Arch D paper.  

Longer answer:  The price is $150 up to 1000 acres of contiguous property, then it will need to go up from there.  Thank you for the reminder, I need to change that on my website.  I always include as much of the relevant watershed as possible, at no extra charge, for the hydrology analysis.  I did a property last week that ended up being 8000 acres including the watershed and it really bogged my old computer down.  

You do not need QGIS at all to read the maps, but you will need to use it if you want to go into the details.  I provide the maps in PDF and Google Earth Pro format.  Google Earth Pro is much simpler to use than QGIS, all you will need to do is drag and drop the 'Your_Farm_Name.kmz' file into a GEPro window and it will load the layers, which you can simply toggle on and off.  You cannot really manipulate the layers or zoom as well in GEPro as you can in QGIS, it's for viewing and drawing with the basic tools included in GEPro, but it's the same data and maps.  Keep in mind that the raster based maps (like slope and aspect you mentioned earlier) are generated from the original DEM and carry the same resolution - so best case scenario if you have 1 meter resolution that means that each square meter will be it's own color in these maps and if you zoom way in you will be able to see individual pixels. I have attached some screenshots of a design project I'm working on right now with the aspect map (called Southness - red areas face South, blue areas face North) zoomed out and zoomed in.  For reference this project has 1m DEM resolution and the points on those lines are 40' apart (and I just set the point colors to random while I'm working - this isn't a finished product).  You can see the pixels when zoomed in, but they all blend when zoomed out.  In this part of the world many tree fruits will bloom too early on South facing slopes so I often toggle on this basemap to see which places are best for something like apples and pears, which this client wants mixed into this silvopasture layout.  

The PDFs can be opened with any program that reads PDFs.  They are generated with QGIS and if you want to create more or change them in any way you will need to use QGIS.  Print Layout is, in my opinion, the absolute most difficult part of QGIS so I have attempted to make it simple - if you open the project in QGIS and go to the print layout you should be able to simply pan/zoom the map or turn on and off visible layers and export one or many new PDFs.  I hope that anyone who uses something like Adobe Illustrator could just open the PDFs, replace my name and logo with their own and start drawing their concept.  All of the PDFs are to scale on Arch D paper which is quite large, so depending on the size of the project and DEM resolution they may or may not be zoomed all the way in or out.  My local print shop will print on whiteboard style board, I am going to try this out soon with my own farm so I can just write/draw out tasks with a dry erase marker.  

I appreciate the questions, feel free to ask more!
Greg
Screenshot-at-2026-01-22-09-22-17.png
Mid-Level Zoom
Mid-Level Zoom
Screenshot-at-2026-01-22-09-23-01.png
Zoomed In
Zoomed In
 
Kimi Iszikala
pollinator
Posts: 220
Location: Colorado Plateau, New Mexico
48
fungi foraging composting toilet building solar greening the desert
  • Mark post as helpful
  • send pies
    Number of slices to send:
    Optional 'thank-you' note:
  • Quote
  • Report post to moderator
Well, this all sounds super cool.  Thanks for the very helpful explanation.

I dug back through my old emails and found my 2018 conversations with the EDAC folks at UNM. Our area is at 1m resolution. At the time I talked with them, I think it was 2016 data; I have no idea if it's been updated.

This looks really fun to play with. I am going to write it into the soil remediation grant I'm writing just to see if they'll go for it (it would also make more folks in our area aware of the resource). If they don't, we will probably end up getting it. We were able to get our LiDAR data in 2018, but at least at that time we could only access it with MARS software and it was way cumbersome. Hopefully going down the rabbit hole playing with maps won't keep me from making the progress on our soils!!
 
G Sherb
Posts: 6
4
  • Likes 2
  • Mark post as helpful
  • send pies
    Number of slices to send:
    Optional 'thank-you' note:
  • Quote
  • Report post to moderator
Thank you Kimi, I really do appreciate all of your feedback.  Good luck with your grant!

I do want to be clear that I am creating these basemaps with freely available data including the Lidar derived DEMs, NRCS soils data, and Imagery.  All of it can be accessed for free without using my product, I'm just trying to add value by making it accessible since, as you've noted, it's not easy.  While I'm sure anyone could figure out how to view it all with enough time I figured that since I have put in that time myself for my own projects I might as well share it with those who would rather not take that time.  

My real goal is that I will help folks spend less time with a computer and more time with a shovel (but that they would know where to use that shovel from the maps).  

-Greg
gift
 
Rocket Mass Heater Manual
will be released to subscribers in: soon!
reply
    Bookmark Topic Watch Topic
  • New Topic