• Post Reply Bookmark Topic Watch Topic
  • New Topic
permaculture forums growies critters building homesteading energy monies kitchen purity ungarbage community wilderness fiber arts art permaculture artisans regional education skip experiences global resources cider press projects digital market permies.com pie forums private forums all forums
this forum made possible by our volunteer staff, including ...
master stewards:
  • Nancy Reading
  • Carla Burke
  • r ranson
  • John F Dean
  • paul wheaton
  • Pearl Sutton
stewards:
  • Jay Angler
  • Liv Smith
  • Leigh Tate
master gardeners:
  • Christopher Weeks
  • Timothy Norton
gardeners:
  • thomas rubino
  • Jeremy VanGelder
  • Maieshe Ljin

New USDA Zone Maps

 
master gardener
Posts: 4240
Location: Upstate NY, Zone 5, 43 inch Avg. Rainfall
1718
monies home care dog fungi trees chicken food preservation cooking building composting homestead
  • Likes 6
  • Mark post as helpful
  • send pies
    Number of slices to send:
    Optional 'thank-you' note:
  • Quote
  • Report post to moderator
https://www.ars.usda.gov/news-events/news/research-news/2023/usda-unveils-updated-plant-hardiness-zone-map/

It seems that the U.S. Department of Agriculture has updated their USDA zone maps with quite a bit of change for many areas.

Do you live in one of these zones? Do you think it is accurate? I want to se what people's thoughts and feelings are on this topic.

My area didn't change and I find it pretty accurate to my own local conditions.
 
gardener
Posts: 1805
Location: Zone 6b
1126
forest garden fungi books chicken fiber arts ungarbage
  • Likes 3
  • Mark post as helpful
  • send pies
    Number of slices to send:
    Optional 'thank-you' note:
  • Quote
  • Report post to moderator
Here are maps of 2012 and 2023.
Mine changed from 6b to 7a. Does it mean I can grow more figs?
Screenshot_20231118_210536_Chrome.jpg
2012 national map
2012 national map
Screenshot_20231118_205921_Chrome.jpg
2023 map
2023 map
 
Posts: 49
Location: Northern Colorado (Zone: 3b/4a)
14
transportation dog hunting earthworks chicken bee building wood heat
  • Likes 5
  • Mark post as helpful
  • send pies
    Number of slices to send:
    Optional 'thank-you' note:
  • Quote
  • Report post to moderator
It looks to warm along the continental divide to me. I know ranchers that were having to use straight #1 diesel in their trucks last winter, because the winter blend diesel was gelling. They were saying it was -30-40F at night for about a week, and the cows and sheep were coughing up blood, because it was frosting their lungs. I found a block of 6a that's likely above 7000ft, and probably 3a or colder during bad winters. Last winter was exceptionally bad, but I'd figure they'd try to make the map the coldest likely temperature for the next ~50years, not what it might be during a really mild winter.
6aUSDS.png
[Thumbnail for 6aUSDS.png]
 
steward
Posts: 12423
Location: Pacific Wet Coast
6991
duck books chicken cooking food preservation ungarbage
  • Likes 7
  • Mark post as helpful
  • send pies
    Number of slices to send:
    Optional 'thank-you' note:
  • Quote
  • Report post to moderator
I'm in Canada, so the maps don't apply, but I've noticed that the "average" isn't changing as much as the "extremes" are. If you have a week at above average warmer, followed by a week of below average, the "average" doesn't change much.
 
master pollinator
Posts: 4988
Location: Canadian Prairies - Zone 3b
1351
  • Likes 3
  • Mark post as helpful
  • send pies
    Number of slices to send:
    Optional 'thank-you' note:
  • Quote
  • Report post to moderator

Peter E Johnson wrote:I know ranchers that were having to use straight #1 diesel in their trucks last winter, because the winter blend diesel was gelling. They were saying it was -30-40F at night for about a week, and the cows and sheep were coughing up blood, because it was frosting their lungs.  


I can't speak to your experience, though I must say it doesn't mesh with my experience.

Winter diesel up here (perhaps a different formulation?) keeps everything humming along through our very cold and long winter.

Also, I have spent many years working with cattle in this cold climate. They toughen up and adapt to the cold, like humans do, given adequate feed and shelter. I think they are tougher than humans, frankly. I have never seen one coughing up blood when it gets cold.
 
gardener
Posts: 5436
Location: Southern Illinois
1487
transportation cat dog fungi trees building writing rocket stoves woodworking
  • Likes 5
  • Mark post as helpful
  • send pies
    Number of slices to send:
    Optional 'thank-you' note:
  • Quote
  • Report post to moderator
I think Jay hit the nail on the head.  I am was in zone 6b, but now my zone is 7a.  Honestly, I don’t really notice a difference in terms of the spring warm-up or the fall cool-down, but last summer was brutal!  And I think that, like Jay said, that the extremes seem to be more important than the seasonal average.

I am starting to wonder if the USDA zone maps even matter as my most important weather concern is not last/first frost but rather a mid-summer drought.  And last summer we definitely had a drought and unfortunately we as still in a dry spell, though not as bad as we were in summer.  I don’t know if the coming El Niño will matter much for me.

Eric
 
pioneer
Posts: 84
54
homeschooling kids fungi foraging urban food preservation fiber arts medical herbs homestead ungarbage
  • Likes 4
  • Mark post as helpful
  • send pies
    Number of slices to send:
    Optional 'thank-you' note:
  • Quote
  • Report post to moderator
I’m also in former 6b/new 7a and it rings true for me. The last two years I’ve planted twice, once by each set of recommendations, and the 7a plantings have fared much better. I am in coastal RI, though, and I wonder if the warming ocean is more of a factor here.

I also echo that midsummer drought-it’s becoming increasingly unrealistic to grow tomatoes and summer squash without frankly exorbitant irrigation.
 
Peter E Johnson
Posts: 49
Location: Northern Colorado (Zone: 3b/4a)
14
transportation dog hunting earthworks chicken bee building wood heat
  • Likes 5
  • Mark post as helpful
  • send pies
    Number of slices to send:
    Optional 'thank-you' note:
  • Quote
  • Report post to moderator

Douglas Alpenstock wrote:
I can't speak to your experience, though I must say it doesn't mesh with my experience.

Winter diesel up here (perhaps a different formulation?) keeps everything humming along through our very cold and long winter.

Also, I have spent many years working with cattle in this cold climate. They toughen up and adapt to the cold, like humans do, given adequate feed and shelter. I think they are tougher than humans, frankly. I have never seen one coughing up blood when it gets cold.


Generally the only times people around here have problems with gelling is if we get an early cold front, and the gas stations haven't switched over to a strong enough winter blend yet. They use to advertise what their winter blend was on the pumps, but I never see that anymore. I think they use to advertise 60% #1 and 40% #2 during the middle of the winters. Who knows what these ranchers were doing? Possibly trying to blend it themselves out of some 500gallon above ground tanks.

One guy that told me that they were coughing up blood use to be a state brand inspector, and I know he was sledding hay with a snowmobile out to his ~25 cows for most of the winter. He told me that he didn't loose a single cow, but he did loose some calves in a late spring storm. The cows are tough, and if they have water so they don't have to eat snow they tend to survive.

I didn't mean to take this thread horribly off topic. My point was that about every 10-20 years we get a really nasty winter. I would expect the USDA to encourage people to plant trees and things that would survive the worst winters, not the average or mild winters.
 
Timothy Norton
master gardener
Posts: 4240
Location: Upstate NY, Zone 5, 43 inch Avg. Rainfall
1718
monies home care dog fungi trees chicken food preservation cooking building composting homestead
  • Likes 1
  • Mark post as helpful
  • send pies
    Number of slices to send:
    Optional 'thank-you' note:
  • Quote
  • Report post to moderator
I merged your stuff with the following thread. I hope that is okay by you.
 
gardener
Posts: 3132
2095
  • Likes 3
  • Mark post as helpful
  • send pies
    Number of slices to send:
    Optional 'thank-you' note:
  • Quote
  • Report post to moderator
I have mixed feelings. While the average temperatures may be trending the way they show, it feels like in my area at least the weather is becoming more chaotic in general, and if anything it may bump me into a colder zone rather than a warmer one, at least where plants are concerned. It doesn't just take an average to kill a plant, but a single cold snap can do it as well.
 
gardener
Posts: 1674
Location: the mountains of western nc
505
forest garden trees foraging chicken food preservation wood heat
  • Mark post as helpful
  • send pies
    Number of slices to send:
    Optional 'thank-you' note:
  • Quote
  • Report post to moderator
yup. like the new average is a zone higher but one event every few years is like it’s a zone colder.
 
gardener
Posts: 3489
Location: Fraser River Headwaters, Zone3, Lat: 53N, Altitude 2750', Boreal/Temperate Rainforest-transition
689
hugelkultur forest garden fungi trees books food preservation bike solar woodworking
  • Likes 3
  • Mark post as helpful
  • send pies
    Number of slices to send:
    Optional 'thank-you' note:
  • Quote
  • Report post to moderator
I agree.  

We have been trending way, way warmer in general, but we had almost no snow last year compared to normal, and had a wicked -40 cold snap with no insulation on the ground.  

We have been trending way drier too.  This spring and summer and into the fall saw record drought, here, this year and it hasn't finished yet.  

So the mapping was already way off around here too.  

The chaos is really apparent for sure.  

Around here, I look at 6 different 'local' weather forecasts as we don't have a proper weather station around here.  None of them are a guarantee.  Most of them are quite divergent in predictions.  I only bother with them to gain a rough average and then hope that my basic needs will be met.  I'm lucky.  I have a creek on my land.  It never got anywhere near it's regular high flow this year, but it ran.  Lots of people lost their water in my region.  
 
Jordan Holland
gardener
Posts: 3132
2095
  • Likes 3
  • Mark post as helpful
  • send pies
    Number of slices to send:
    Optional 'thank-you' note:
  • Quote
  • Report post to moderator
Funny, I almost mentioned the dryness as well. It hasn't been that extreme here, but I think the added stress from that also has the same effect as being in a slightly colder zone. For about a decade now, I've noticed a drop in the number of dogwoods here. In the past two years, I've noticed many full-grown trees that are otherwise apparently healthy dying. Oaks, maples, elms. Typically hardy trees. On the other side, I've noticed several more young paw-paw trees which seemed to previously have been waning since I was a kid.
 
pollinator
Posts: 120
Location: South Louisiana, 9a
36
  • Likes 2
  • Mark post as helpful
  • send pies
    Number of slices to send:
    Optional 'thank-you' note:
  • Quote
  • Report post to moderator
I moved from 9a to 8b last year. Now I'm right back in 9a. The length of summers here has always been tough to bear, but thankfully they were often broken up by thunderstorms and cooling rains. It hardly rained this past summer, which made coping much harder. On the bright side, 8b seemed a stretch to grow grapefruit. I think I will plant a tree now that USDA has confirmed what we've all felt.
 
steward and tree herder
Posts: 8380
Location: Isle of Skye, Scotland. Nearly 70 inches rain a year
3973
4
transportation dog forest garden foraging trees books food preservation woodworking wood heat rocket stoves ungarbage
  • Likes 3
  • Mark post as helpful
  • send pies
    Number of slices to send:
    Optional 'thank-you' note:
  • Quote
  • Report post to moderator
According to the link given the map is based on coldest nightly temperatures over the last few years (not the hottest summer temperatures) so it ought to be reasonably accurate for use in assessing whether a plant is going to be cold hardy in the continental US.
The plant hardiness rating never works for me here because the lack of summer heat and constant wet soil (and dark winter days) means that plants often just rot in winter despite relatively mild temperatures.
 
Posts: 68
5
  • Mark post as helpful
  • send pies
    Number of slices to send:
    Optional 'thank-you' note:
  • Quote
  • Report post to moderator
Hey, Idk if this is the right spot for this, so let me know if I'm wrong. (Also where I should put it, instead). https://lifehacker.com/home/usda-plant-hardiness-zone-map-changes?utm_source=email&utm_medium=newsletter&utm_campaign=lifehackerdaily&zdee=gAAAAABk5tkRxXrK4YYv1n2uxQyazi6uoB42bGJp-c3jZlvw-XtuH6PJVCNVXapniobYTgDsHajk0R-MpRJgQREXgh5Xv6RqmX3uMCbounNvo99lmNT6CpE7HhH1a_ONjVhKoTp2tFYx
 
steward
Posts: 3423
Location: Maine, zone 5
1955
7
hugelkultur dog forest garden trees foraging food preservation cooking solar seed wood heat homestead
  • Likes 4
  • Mark post as helpful
  • send pies
    Number of slices to send:
    Optional 'thank-you' note:
  • Quote
  • Report post to moderator
I went to the interactive map and found that my road is 6A, surrounded in a sea of 5b....fun!  I do live in a forest on a hillside and we do get extra protection from the cold.  I'm just amazed the map caught that somehow.  Can they really be that good?
 
pollinator
Posts: 95
Location: Cascadian lowlands (8b, sunset zone 5)
31
  • Likes 6
  • Mark post as helpful
  • send pies
    Number of slices to send:
    Optional 'thank-you' note:
  • Quote
  • Report post to moderator

Greg Martin wrote:I went to the interactive map and found that my road is 6A, surrounded in a sea of 5b....fun!  I do live in a forest on a hillside and we do get extra protection from the cold.  I'm just amazed the map caught that somehow.  Can they really be that good?


The page where they discuss the methodology says that yes, they can really be that good! Here's a quote from there:

In the end, data from a total of 13,625 stations—a substantial increase compared to the 2012 map version--were incorporated into the maps. The USDA PHZM was produced with the latest version of PRISM, a highly sophisticated climate mapping technology developed at Oregon State University. The map was produced from a digital computer grid, with each cell measuring about a half mile on a side. PRISM estimated the mean annual extreme minimum temperature for each grid cell (or pixel on the map) by examining data from nearby stations; determining how the temperature changed with elevation; and accounting for possible coastal effects, temperature inversions, and the type of topography (ridge top, hill slope, or valley bottom).

 
Roberto pokachinni
gardener
Posts: 3489
Location: Fraser River Headwaters, Zone3, Lat: 53N, Altitude 2750', Boreal/Temperate Rainforest-transition
689
hugelkultur forest garden fungi trees books food preservation bike solar woodworking
  • Likes 1
  • Mark post as helpful
  • send pies
    Number of slices to send:
    Optional 'thank-you' note:
  • Quote
  • Report post to moderator

Winn Sawyer wrote:

Greg Martin wrote:I went to the interactive map and found that my road is 6A, surrounded in a sea of 5b....fun!  I do live in a forest on a hillside and we do get extra protection from the cold.  I'm just amazed the map caught that somehow.  Can they really be that good?


The page where they discuss the methodology says that yes, they can really be that good! Here's a quote from there:

In the end, data from a total of 13,625 stations—a substantial increase compared to the 2012 map version--were incorporated into the maps. The USDA PHZM was produced with the latest version of PRISM, a highly sophisticated climate mapping technology developed at Oregon State University. The map was produced from a digital computer grid, with each cell measuring about a half mile on a side. PRISM estimated the mean annual extreme minimum temperature for each grid cell (or pixel on the map) by examining data from nearby stations; determining how the temperature changed with elevation; and accounting for possible coastal effects, temperature inversions, and the type of topography (ridge top, hill slope, or valley bottom).


Now if they took data like that, loaded about 5 years worth of it into an AI, they would probably see that the variation in the average is, as stated by Jay Angler, likely to come out a great deal more extreme.  Here, even before the weather got super whacked out, we had frost potential every month of the summer.  That hasn't changed around here.  Now, in addition, this year we had trees budding in late October and into mid to late November.   The map won't adapt to that kind of extreme strangeness especially since it seems that it might be completely different or opposite next year by the way things are going.  We had an extreme cold snap mid October last year of -18 C, which is a few weeks to a month early.  This year the opposite.
 
Winn Sawyer
pollinator
Posts: 95
Location: Cascadian lowlands (8b, sunset zone 5)
31
  • Likes 4
  • Mark post as helpful
  • send pies
    Number of slices to send:
    Optional 'thank-you' note:
  • Quote
  • Report post to moderator

Roberto pokachinni wrote:
Now if they took data like that, loaded about 5 years worth of it into an AI, they would probably see that the variation in the average is, as stated by Jay Angler, likely to come out a great deal more extreme.


The hardiness zones have always been only a rough guide, since they've always been based solely on the average annual minimum temperature rather than absolute minimum you will experience in that zone. It's to be expected that you will get colder than your zone range in some years.

Here in Seattle, we are below 20°F in at least a few years every decade, and have even been below 15°F a few times in the last 30 years, but we've moved to zone 9a because there are more years where the minimum is above 20°F than below (and we're increasingly getting years where the minimum is above 25° even). I definitely think our overall climate is warming enough to warrant the move up half a zone, even though two of the last three years were colder than the 9a range.

It's absolutely true that climate instability from climate change will mean more frequent extreme swings in both directions in many locations, but I don't think it would be a good idea to add too many complicating factors to the hardiness zones, which are simple for a reason. No one should rely solely on their USDA zone when deciding what to plant, but that would be true even if everyone used more complicated systems like the "sunset zones" that are popular in California. Even sunset zones will experience unusual weather for their zone as the climate continues to change and destabilize!
 
Posts: 39
Location: Rocky Mountains
13
medical herbs wood heat ungarbage
  • Mark post as helpful
  • send pies
    Number of slices to send:
    Optional 'thank-you' note:
  • Quote
  • Report post to moderator
Just a heads up that the USDA updated the "Plant Hardiness Zone Map".   (Warmer temperatures shifting northward since the last map update in 2012.)  May want to check if your zone has changed for this next planting season.

https://planthardiness.ars.usda.gov/

2023.11.30_PlantingZoneUpdated.png
Updated Zone Map
Updated Zone Map
 
pollinator
Posts: 717
Location: Clackamas Oregon, USA zone 8b
76
  • Mark post as helpful
  • send pies
    Number of slices to send:
    Optional 'thank-you' note:
  • Quote
  • Report post to moderator
It looks like mine hasn't changed, still 8B over here.  But some people's have changed.
 
pollinator
Posts: 426
162
  • Likes 8
  • Mark post as helpful
  • send pies
    Number of slices to send:
    Optional 'thank-you' note:
  • Quote
  • Report post to moderator
Yeah, the USDA system is quite limited, isn't it? Which becomes especially apparent if you try to apply the supposed USDA zone to, say, Scandinavian conditions. Much of the norwegian coast is USDA zone 6 or 7, but there are loads of plants that are supposedly hardy to 6, or even 5, that we can probably only dream of growing. There are so many more factors at play than winter minimum temperature. Winter duration and temperature profile, whether you get thawing conditions in the middle of winter followed by freezing again, snow cover (like someone mentioned), humidity, latitude (and its effect on day length), etc etc...

Around here, each country has a zone designation system that tries to take some of these variables into account, to fit better in the specific context of the country. But ultimately, I guess all such systems are at best guidelines, since the variation in how each plant species handles each of the variables can be huge. For instance, I recently learned that butternut trees will leaf out when the daylight length reaches 14 hours, regardless of air temperature...
 
Posts: 7
1
  • Likes 2 Likes 1
  • Mark post as helpful
  • send pies
    Number of slices to send:
    Optional 'thank-you' note:
  • Quote
  • Report post to moderator
I've questioned the USDA maps because they are only averages of minimums, so I assume more applicable to short-lived perennials and sheltered locations, and because they just aren't correct where I have lived.  I've been paying attention to lows since I was old enough to be responsible for chores, especially keeping water available for livestock.  Not accurate, but still close enough for most things.

But this new version really gripes my ass.  The numbers from local weather stations and airports are not even remotely what they are showing.  It shows me as a zone where I have never seen a winter that warm, no less an average.  It's outright bullshit.

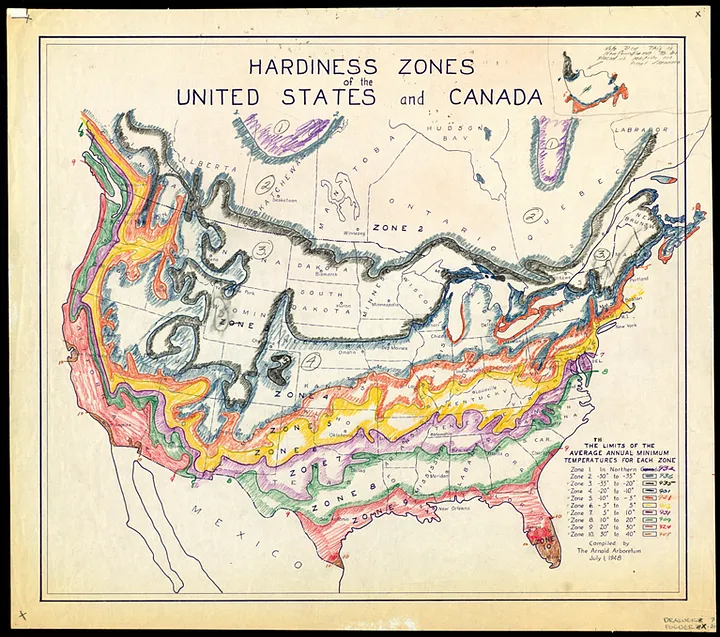
Anyone else find the 1948 Arnold Arboretum more accurate in the last decade?  Even the colored pencil version

https://miro.medium.com/v2/resize:fit:720/format:webp/0*Fnlq8_-ju6suRGq-
 
Winn Sawyer
pollinator
Posts: 95
Location: Cascadian lowlands (8b, sunset zone 5)
31
  • Likes 1
  • Mark post as helpful
  • send pies
    Number of slices to send:
    Optional 'thank-you' note:
  • Quote
  • Report post to moderator

Oscar Domstede wrote:
The numbers from local weather stations and airports are not even remotely what they are showing.


Do you have specific examples? I've pulled the daily temperature data from here for my area and it agrees perfectly with the new zone:

https://www.ncei.noaa.gov/cdo-web/search?datasetid=GHCND

For example, Seattle's 30-year average annual minimum has moved from the 8b range to the 9a range, just as they show:

 
pollinator
Posts: 976
Location: Porter, Indiana
166
trees
  • Likes 1
  • Mark post as helpful
  • send pies
    Number of slices to send:
    Optional 'thank-you' note:
  • Quote
  • Report post to moderator
Here's the best post I've seen on the new USDA zones. It gives a good example of how the information can be useful along with some of the limits.

First, let's discuss how the zones are calculated.  The zones are calculated based on 30 years of temperature data (1991 to 2020).  For each year, the lowest temperature of the year is recorded.  Next, the average of those 30 numbers is taken and compared to the scale.  Each zone on the scale has a width of 10 degrees F. Each sub-zone has a width of 5 degrees F.  For example, zone 6 spans from -10 deg F to 0 deg F, with zone 6b being -5 to 0 and zone 6a being from -10 to -5.  To illustrate this, in the chart below, I pulled the temperature data from the weather station at Indianapolis International Airport.  Each red column represents the minimum extreme temperature for that year.  The horizontal blue line is the average of all 30 years.  In this case, that average is -4.9 deg F.  This means that, for this particular region, the hardiness zone designation is zone 6b.  Note that this average number is the ONLY factor used in calculating hardiness zones.  Summer temperatures, chill hours, growing degree days, number of frost free days, etc.  have absolutely no direct influence on the hardiness zone calculation.

Next, let's discuss how to use the hardiness zone information.  First off, the hardiness zone means virtually nothing regarding the growing of annual plants.  This is because those plants are not even alive when the minimum low temperatures occur.  Whether it gets to -20 or -40 in the winter doesn't (directly) impact what tomatoes you can grow in your garden.  Next, people are sometimes tempted to think like this: "I'm in zone 6b.  Zone 6b goes down to -5 deg F.  So if the tree or perennial that I'd like to plant is hardy to -5 deg F, then all is well."  This is incorrect.  To illustrate this, look at the IND airport temperature chart again. Yes, the *average* minimum temperature is -4.9 deg F, however, 15 of the 30 years had low temperatures lower than -5 deg F.  In fact, in 1994, the temperature got down to -27 deg F (more on that later).  So if whatever you plant can only take down to -5 deg F, there's a 50-50% chance that it will get damaged/killed any given winter. I don't like those odds.

To get the whole picture, we need to look at more than just the average.  Statisticians use a metric called the standard deviation to quantify how much variation there is in any given data set.  If a data set has a large standard deviation, there is a lot of variation.  Conversely, a small standard deviation indicates little variation.  I won't get into the math details here, but a simple online search can tell you how to calculate standard deviation. Most natural distributions are distributed like the classic "bell curve", also called a "normal distribution". Statistically, 67% of all the data falls within +/- one standard deviation of the average; 95% of the data falls within +/- 2 standard deviations, and 99.7% falls within +/- 3 standard deviations.  Returning to our IND airport example, the standard deviation of that data set is 7.7 deg F.  So, the average minus one standard deviation is -12.6 deg F (-4.9 minus 7.7),  This is shown on the chart with the green line.  Statistically, we would expect 16% of the data to be greater than the average minus one standard deviation. This means that roughly one out of every 6 years, we would expect temperatures to dip down to at least -12.6 deg F.  In our example, it happened twice (1994 and 2014).  If you are planting a tree that you expect to be around for 20+ years, one in 6 still feels like pretty poor odds to me.

If we use two standard deviations rather than one, statistically speaking, we would expect 97.6% of the data to be above the average minus two standard deviations.  This would mean we would expect roughly one year in every 42 years to have a low temperature less than this value.  In our example, the average minus two standard deviations is -20.4 deg F, shown by the gray line in the chart.  As you can see, we did have one example (1994) when the low temperature did get that low.  Note that this temperature, -20.4, would actually correspond to zone 4b on the hardiness zone scale.  So we would need our tree to be "zone 4 hardy" to be happy here in zone 6. We could keep going, but hopefully you understand the process here.  Statistically, only 1 year out of every 700 years should fall below the average minus 3 standard deviations.


999.jpg
Indianapolis Low Temps For the Past 30 Years
 
Oscar Domstede
Posts: 7
1
  • Mark post as helpful
  • send pies
    Number of slices to send:
    Optional 'thank-you' note:
  • Quote
  • Report post to moderator

Winn Sawyer wrote:
Do you have specific examples? I've pulled the daily temperature data from here for my area and it agrees perfectly with the new zone:

https://www.ncei.noaa.gov/cdo-web/search?datasetid=GHCND


Couldn't make that work.  Using the numbers from local stations on the charts at https://www.weather.gov/wrh/climate it was only ~1 degree different from the average of my own numbers for the 11 years since the map change.  Closer than I expected, averages work that way I guess.  I thought they used to have all their data recorded somewhere, anyone know?

But that still puts it a full zone off from the changed direction of the updated map.

If anyone wants to have another source, look up your local airport.  There is often a phone number for ASOS or AWOS and it will give you the conditions at the moment at the field.  Temp, wind, barometric pressure, dew point, etc.
 
Winn Sawyer
pollinator
Posts: 95
Location: Cascadian lowlands (8b, sunset zone 5)
31
  • Likes 2
  • Mark post as helpful
  • send pies
    Number of slices to send:
    Optional 'thank-you' note:
  • Quote
  • Report post to moderator

Oscar Domstede wrote:
Couldn't make that work.  


You just have to search for any NOAA station name (airports are great ones to look for), then add the Daily Summary for that station to your cart, choose the CSV format instead of PDF, make sure it includes the full date range you want, make sure the "Air Temperature" box is checked, then submit the order. You'll get an email within a few minutes with a link to download the CSV, then you can import that into Excel or Google Sheets to analyze it.

Here's another example of a chart I made for Seattle using Google Sheets and that data:


It's pretty clear from that chart that the time period used for the new map (1991 to 2020) was significantly less cold than the prior years.

EDIT: It looks like you can also get a pretty good amount of data from your regional NWS website via this map (click on the regional one to search data for any station in that region), as you noted:

https://www.weather.gov/wrh/climate

Where you can get the monthly summary data for any span of years for lowest temperature, like this one, which shows an average of 21°F (the 9a zone we moved to on the latest update):
Screenshot_20231206-231615.png
[Thumbnail for Screenshot_20231206-231615.png]
 
Posts: 521
Location: Iqaluit, Nunavut zone 0 / Mont Sainte-Marie, QC zone 4a
90
2
  • Mark post as helpful
  • send pies
    Number of slices to send:
    Optional 'thank-you' note:
  • Quote
  • Report post to moderator

Peter E Johnson wrote:It looks to warm along the continental divide to me.


I saw the new map last week and had the exact same reaction. Interesting. Thanks for the input
 
pollinator
Posts: 2538
Location: RRV of da Nort, USA
722
  • Likes 6
  • Mark post as helpful
  • send pies
    Number of slices to send:
    Optional 'thank-you' note:
  • Quote
  • Report post to moderator
I don't know if this will be of much use to those outside of the region,  but will post it here in case.

The web address for this information shown below is https://ndawn.ndsu.nodak.edu/

The home page map shows the locations around the state of North Dakota and some of NW Minnesota for 'micro' weather stations that collect surface climate data, but also sub-soil temperature data.  The snapshots below are of the map and one of the graphs showing soil temperatures at various depths and updated hourly.  Where something like this may be of use when combined with climate zones and above soil temperature may be in the prediction of deep soil temperature based upon recent surface temperature data.  And even if two locations separated by a large distance may have had the same recent weather and now have a similar soil temperature at 5 cm, one could compare the soil temperate at various strata in heavy clay soils (eastern part of state) to more sandy soils (more typical of Badlands in the west).  I would think other states have such resources....could be combined with USDA zone maps to make judgement calls on planting, type of structures/greenhouses to build, etc.

Edit....The legend for the graph says the temperature values are in Celsius where it is clear they are Fahrenheit.
NDAWNmicrostations.JPG
[Thumbnail for NDAWNmicrostations.JPG]
SoilTemperatures.JPG
[Thumbnail for SoilTemperatures.JPG]
 
master pollinator
Posts: 4954
Location: Due to winter mortality, I stubbornly state, zone 7a Tennessee
2118
6
forest garden foraging books food preservation cooking fiber arts bee medical herbs
  • Likes 4
  • Mark post as helpful
  • send pies
    Number of slices to send:
    Optional 'thank-you' note:
  • Quote
  • Report post to moderator
Is it no longer a plant hardiness chart?

I do not agree with this map. It may well be correct according to their parameters. However it is dead wrong when it comes to successfully overwintering perrenials successfully.

My winters are getting more severe. Our days and nights with temperatures below freezing are occurring consecutively instead of spaced out over a couple of months. This past winter storm had us below freezing in daytime for almost two weeks. In the past 20 years, it has been rare for more than 2 days in a row

Having been without air conditioning for two summers, I can assure you that 2023 was quite cooler than 2021.

The last map put me at 7b a zone too warm when it comes to plant care. I have killed plants slated for zone 6 in the past. Shall I  aim for zone 5 now?

Zone 8a is just bullshit! At least I still have 9 months of growing season.
 
Posts: 36
Location: Central PA, gradually relocating to Central Upstate NY
20
homeschooling forest garden trees fiber arts writing homestead
  • Mark post as helpful
  • send pies
    Number of slices to send:
    Optional 'thank-you' note:
  • Quote
  • Report post to moderator
When we moved to central PA 15 years ago, the old USDA zone was 5a (down to -20F) and for many years every winter the temps went down that low pretty regularly.  (One year, it actually went down to -24F!)  But shortly before the new updated map came out, the trend changed to multiple winters in a row that barely touched 0F (zone 7 low).  The new map says we are zone 6a.

It seems strange that such a recent trend change would be enough to raise our hardiness zone based on the last 30 years, but the weather has been consistent to it.  I've been wary about trusting a whole zone change, because my memory of clearly zone 5 weather is relatively recent.  I guess it has me paying attention to climate qualities of my location better than I was before.  We rarely have snow that lasts, so plants have to be able to take exposed cold conditions.  And, we get a lot of late frosts.  For those reasons, I'm not really trusting my now 6a location with plants hardy to less than 5a.

On the other hand, the new location in upstate NY we're moving to is also zone 6a.  (Newly?  I'm not sure, but I think so.)  I've noticed it doesn't seem to have a long string of late frosts to threaten the plants, and it's known for having much more snow cover in winter.  So I'm more likely to trust it as a 6a location.

It is really strange though that the noticeable climate shift in my experience happened so abruptly, and right about the time the map came out.
 
This tiny ad just broke up with me.
A rocket mass heater heats your home with one tenth the wood of a conventional wood stove
http://woodheat.net
reply
    Bookmark Topic Watch Topic
  • New Topic